Below you will see various world maps, on which the surface areas of the individual countries have been adjusted in proportion to a particular statistic. The topics presented demonstrate what the causes of man made greenhouse gas emissions are.
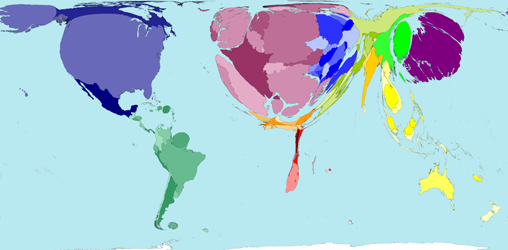
This map shows all the registered miles that were travelled worldwide by aircraft. In 2000 alone, passenger planes covered a total distance of 25 trillion kilometres (and this is growing), this number could circle the Earth 630,000 times. Unlike gasoline, diesel and heating oil, jet fuel is exempt from excise duty. This particularly angered environmentalists, indeed aircraft, due to their high carbon dioxide (CO2) emissions, are one of the most environmentally harmful forms of transport. Under European law since 2005, however, it is possible to tax kerosene at a national level, but so far only the Netherlands and Norway have implemented this tax. Moreover, since 2012, air traffic in the EU has been included in the emissions trading scheme. This means that all airlines that operate within the EU have to buy carbon credits. In 2012, air traffic in Europe alone caused 133 million tonnes of CO2 emissions. The part aviation plays in producing all transport-related greenhouse gas emissions accounts for approximately 13%.
This diagram depicts global car emissions. In 2011, there were about a billion motor vehicles globally, of which about 700 million were passenger cars. It is estimated that this number will have tripled by 2050, because China and India are becoming increasingly motorized. Global energy consumption through road transport will therefore continue to rise sharply. There is a car for every second inhabitant in Europe, for example, while in Tajikistan, there is one car for more than 2000 people. Meanwhile, in the industrialized countries, cars with electric motors, hybrid and fuel cells are on the rise. For markets in emerging and developing countries, however, auto-manufacturers build technologically outdated and polluting cars. Road transport accounts for almost 80% greenhouse gases.
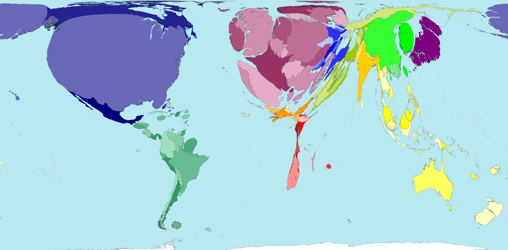
The map shows the worldwide occurrence of cargo ships, as measured by their payload, which were registered. These cargo ships account for 57% of global shipping industry, the majority of the remaining percentage is accounted for by oil transport ships. Military and commercial ships, however, only comprise a small share of the global shipping industry. Most vessels with high load capacity are registered in Panama, Liberia, Malta and Cyprus. Panama alone accounts for 26% of total global registrations. The proportion of all transport-related greenhouse gases made up by shipping is about 7%.
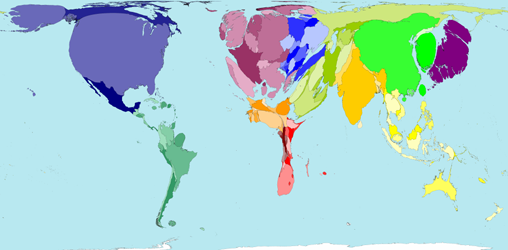
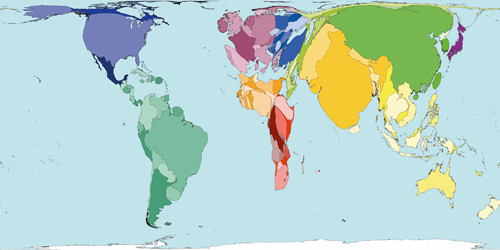
This map shows the fuel consumption (gas, coal, oil, wood and nuclear energy) in the world, meaning what you use, for example, for heating, lighting, transport, or the production of goods. The consumption in the northern hemisphere is much higher - especially in North America, Europe and Japan - than in countries in the southern hemisphere, but in China and India, the demand for energy is also growing steadily. Tonnes of CO2 are released, primarily from the combustion of fossil fuels (coal, gas and oil), thus it is not surprising that the majority of greenhouse gas emissions are attributable to the energy sector. Energy saving and the use of renewable energy sources (geothermal, solar, wind and water) are working towards a more sustainable energy policy.
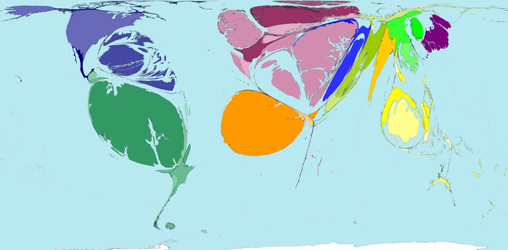
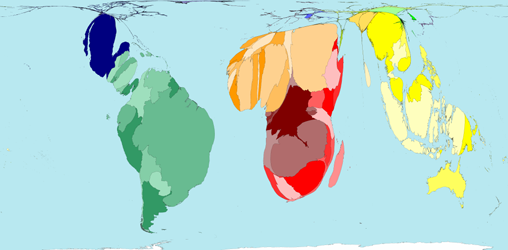
Global forest cover is ever-decreasing. This map shows in which areas the most forest is felled proportionally. Most of them are in South America, especially in Brazil, which has the largest forested area worldwide. There is also a high loss of forests in Southeast Asia. In particular, the tropical rain forest in Indonesia is affected by widespread deforestation. But the forest areas on the African continent are also severely depleted. However, it is forests, which are referred to in the discussion on climate change as carbon sinks, because trees and plants absorb CO2 from the air and store it, thus reducing the greenhouse gases in the atmosphere. Large forest areas are however, still being cleared, for example, to create grazing for cattle, soy oil fields or plantations. Through slash and burn the CO2 stored in the trees is released and the agricultural use of emerging arable land creates additional greenhouse gas emissions.
Correct answer: Methane and nitrous oxide emissions
This map shows the areas in which the most methane and nitrous oxide are emitted proportionally. Agriculture, but also the thawing of permafrost in the Arctic tundra, is responsible for the increase in the greenhouse gases methane (CH4) and nitrous oxide (N2O). Compared to carbon dioxide, methane contributes about 20 times and nitrous oxide about 300 times more to global warming. While methane is produced by rice cultivation, coal mining, energy production, livestock production, in landfills or in the decomposition of organic material by bacteria, nitrous oxide is released by nitrogen fertilizer, natural fertilizer and animal waste, industrial processes and energy use. Approximately 11% of the greenhouse gases emitted worldwide is due to agriculture. Within the debate around climate change, cows are often referred to as the "climate killer". This is because the digestive tract of cattle produces methane; the gas escapes the animal approximately every 40 seconds. As the world's meat consumption increases, so does the concentration of methane in the atmosphere. Over the last 50 years it has increased six-fold.
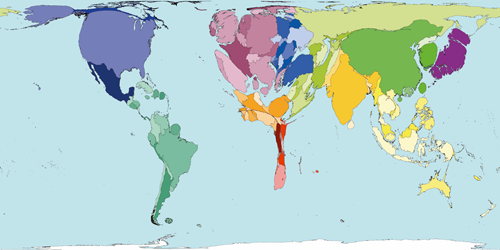
This map shows the amount of waste that accumulates in cities and towns. This includes both the private household waste and the waste from public facilities such as schools. Waste includes packaging, paper, organic waste, bulky waste and hazardous waste. Russia produces the most waste per capita, while there is very little waste in Madagascar, Burkina Faso, Nepal and Costa Rica. Particularly in industrialized countries, there is a variety of disposable equipment. However, in developing countries it is mainly reused. In Austria, waste management, along with animal rearing, produces the largest methane emissions. General waste prevention, waste separation and disposal regulations can reduce the formation of the greenhouse gases, but due to the rise in total waste volumes, comprehensive steps are necessary for the sake of sustainability. About 4% of the world's greenhouse gases are accounted for by waste.
The maps were mostly created some years ago. The numbers that were necessary for their production, however, have changed only slightly in recent years and tend to match the relationship shown, indeed in recent years the situation has been exacerbated further.
Sources
www.worldmapper.org www.unep.org www.vcd.org diepresse.com www.wikipedia.org
Immel, Karl-Albrecht/ Tränkle, Klaus (2001): Aktenzeichen Armut. Globalisierung in Texten und Grafiken. Wuppertal: Peter Hammer Verlag
Buch, Ursula (2008): Klimawandel. Sek. I. Schwalbach/Ts.: Wochenschau-Verl.
Dow, Kirstin/ Downing, Thomas E. (2007): Weltatlas des Klimawandels. Karten und Fakten zur globalen Erwärmung. Hamburg: Europäische Verlagsanstalt